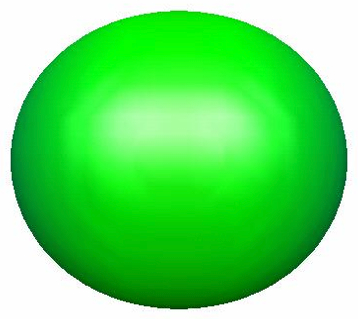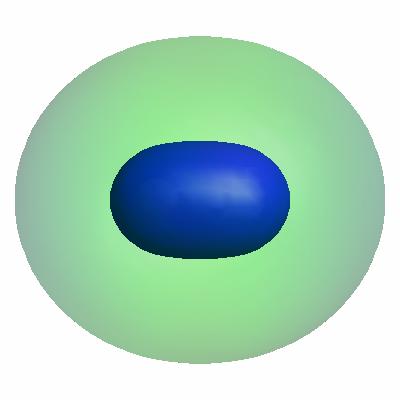
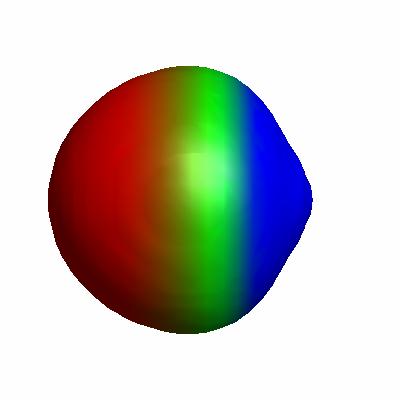
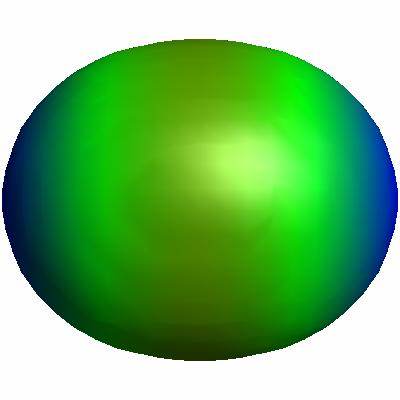
Figure 4.7. 0.0005 au isodensity surface with superimposed electrostatic potential of (a) H–Li, (b) Li, (c) Li2. The maximum potential value is 0.05 au, and the level of theory is B3LYP/6-31G(d).
From Molecular Modeling Basics CRC Press, May 2010.
From Molecular Modeling Basics CRC Press, May 2010.
Figure 4.7 highlights two other kinds of bonds. Note the decrease in the size of the Li atom (and the large positive charge) compared to the Li atom in Li–H. LiH is best thought of as Li+H- (i.e., the bonding electron pair belongs to H- rather than being shared), which is an example of ionic bonding.
Here is an interactive version of Figure 4.7a where the atomic densities of H and Li are superimposed on the density of H-Li.
Click on the picture for an interactive version
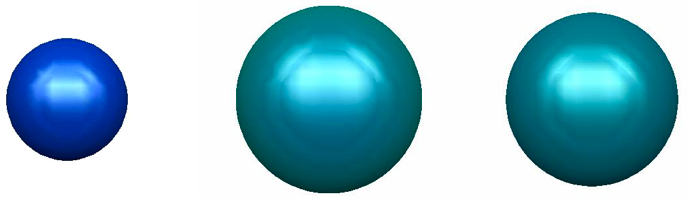
Li2 is more polar than H2: more positive at the ends and more negative in the middle, indicating the a larger rearrangement of electron density upon binding compared to H2. Here is an interactive version (the corresponding Jmol script can be found here; see this post on making plots like this), where I have superimposed the electron densities of the Li atoms and Li2:
Click on the picture for an interactive version
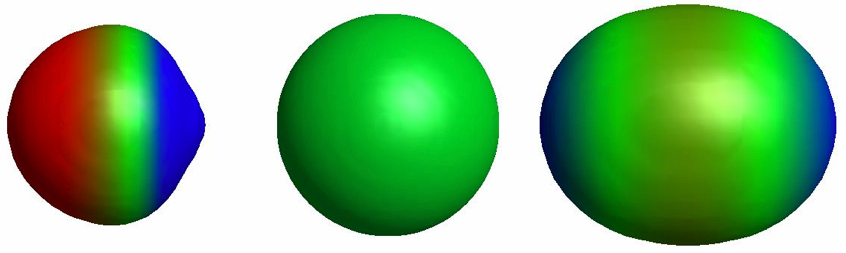
Looking deeper into the density (by using a larger, 0.01 au, isodensity value) reveals a density rearrangement that is quite different from H2: 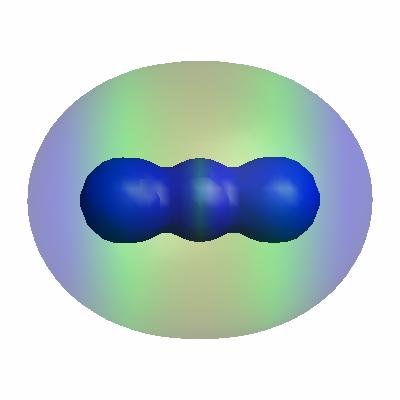
Click on the picture for an interactive version
Here you can see strong localization of electron density between the nuclei, indicating that Li2 is best thought of as Li+:Li+, where ":" indicates an electron pair. This is an example of metallic bonding.
Both ionic and metallic bonding are distinctly different from covalent bonding, in that only covalent bonding leads to the formation of distinct molecules, while ionic and metallic bonding leads to formation of crystals.
To demonstrate this, find the lowest energy structures of H4, Li4, and Li2H2, using, for example, B3LYP/6-31G(d). Go ahead, I'll wait.
Why do I use a different isodensity value for this plot?
I usually use a 0.002 au isodensity surface, but in Figure 4.7 I use 0.0005. This is something I didn't discuss in the book but should have. When I made the plot of the 0.002 au isodensity surface with superimposed electrostatic potential of Li atom, I discovered that is was very blue, i.e. quite positive (go ahead, try it for yourself). I only got a neutral-looking atom when I went down to 0.0005 aus, which is what I have used for the figures (unless otherwise noted).
The positive electrostatic potential on the 0.002 au isodensity surface of Li indicates that a significant amount of density is found outside this surface, which is clearly not the case of the H atom, as shown in a previous post. This, in turn, indicates that the Li electron density decreases more slowly with distance compared to H, which makes sense since Li is much less electronegative than H. Thus, the 0.002 au isodensity surface is a reflection of the van der Waals surface of organic molecules (containing electronegative elements) but not alkali metals.