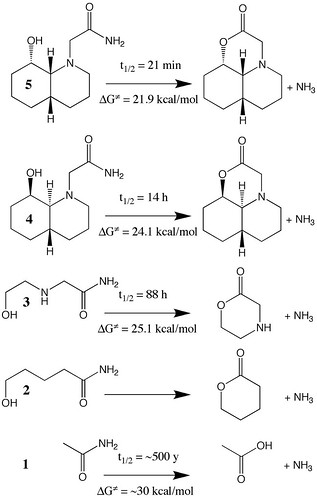
Figure 4.29. Sketch of hydrolysis reaction of several amides together with their experimentally observed half-lives. The free energies of activation are computed via Equations (4.30) and (4.31). (Adapted from N. M. Hernandes et al 2008. Journal of Organic Chemistry 73: 6413–6416.)
From Molecular Modeling Basics CRC Press, 2010
January, 2011 update: The figure in the book is missing an N atom in structures 4 and 5
From Molecular Modeling Basics CRC Press, 2010
January, 2011 update: The figure in the book is missing an N atom in structures 4 and 5
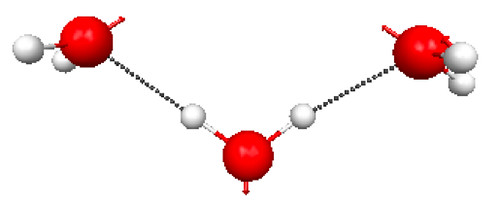
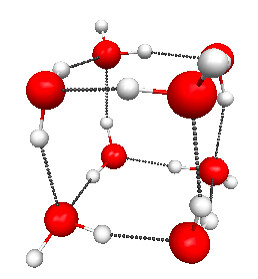
Figure 4.30a and b shows the TS geometries for the hydrolysis of 1 and 3 computed at the PM3 level of theory, together with the normal modes associated with the imaginary frequencies (2336i and 239i cm–1, respectively).

Figure 4.30a. PM3 geometries of the TSs for hydrolysis of compound 1 (Figure 4.29), and the normal modes associated with the imaginary frequencies.
Click on the picture for an interactive version.
From Molecular Modeling Basics CRC Press, 2010

Figure 4.30b. PM3 geometries of the TSs for hydrolysis of compound 3 (Figure 4.29), and the normal modes associated with the imaginary frequencies.
Click on the picture for an interactive version.
From Molecular Modeling Basics CRC Press, 2010
As I show in the book, the predicted activation free energy of 1 is 4.2 kcal/mol higher than the activation free energy for the hydrolysis of 3. The source of the difference is roughly half electronic (1.9 kcal/mol) and half thermodynamic (2.3 kcal/mol). The explanation for the latter is the loss of translational entropy associated with hydrolysis of 1, but it is not obvious why the electronic activation energy should be lower.
For example, one might imagine that it would be energetically unfavorable to fold the chain of 3 into a ring due to some kind of strain when forming the transition state. This can be tested by studying the hydrolysis of 2 (Figure 4.29), which should have roughly the same amount of ring-strain associated with the reaction.
Indeed, the free energy of activation for hydrolysis of 2 is considerably higher than that for 3, and due entirely to an increased electronic activation energy. This points toward the importance of the amine group in the middle of the chain in lowering the electronic barrier for 3-hydrolysis, presumably by stabilizing the partially positive –NH3+-like portion of the TS (Figure 4.31).
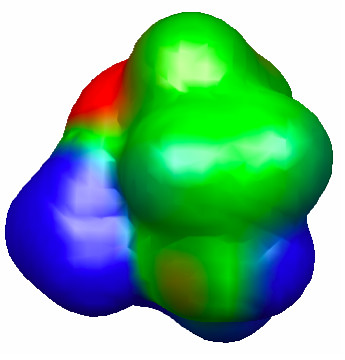
Figure 4.31. 0.002 au isodensity surface with superimposed molecular electrostatic potential of the TS for hydrolysis of 3. The maximum potential value is 0.05 au, and the level of theory is M06/6-31G(d). The orientation is the same as Figure 4.30.
Click on the picture for an interactive version.
From Molecular Modeling Basics CRC Press, 2010
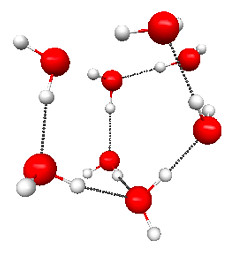
It might be tempting to ascribe the more open TS structure in 3 compared to 1 (Figure 4.30) to ring-strain, but the TS for “methanolysis” of 1 is equally open (Figure 4.32). This is presumably due to steric hindrance of the methanol methyl group and the carbonyl oxygen.
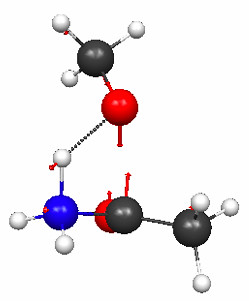
Figure 4.32. PM3 geometries of the TSs for methanolysis of compound 1 (Figure 4.29), and the normal modes associated with the imaginary frequencies.
Click on the picture for an interactive version.
From Molecular Modeling Basics CRC Press, 2010
I will discuss how to find the TS structure for the hydrolysis of 1 in a future post. I have already discussed how to find the TS structure for the hydrolysis of 3 here and here. This post describes how to verify that the TS connects the correct reactants and product, and this post describes the relationship between half lives and activation free energy.