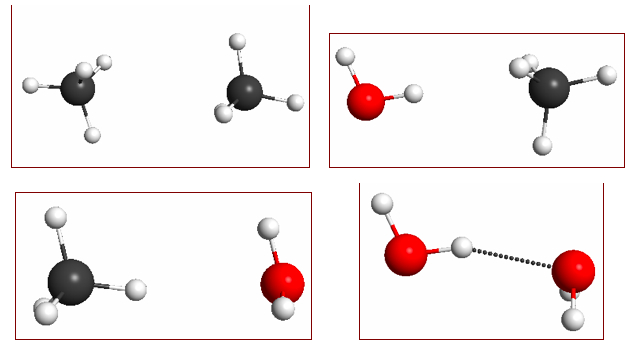
Figure 4.14. M06/6-31G(d) optimized geometries of (a) methane dimer, (b) water–methane dimer where water acts as a H-bond donor, (c) water–methane dimer where methane acts as a H-bond donor, and (d) water dimer.
Click on the picture for an interactive version.
Click here for a pop-up window
From Molecular Modeling Basics CRC Press, 2010
Click on the picture for an interactive version.
Click here for a pop-up window
From Molecular Modeling Basics CRC Press, 2010
The molecular dimers shown in Figure 4.14 have very different interaction energies: -0.5, -1.0, -0.6, and -5.1 kcal/mol, respectively; which are reasonably well reproduced at the M06/6-31+G(2d,p)// M06/6-31G(d) level of theory: -0.4, -0.5, 0.0, and -4.9 kcal/mol.
The source of this difference in intermolecular attraction can be easily visualized with electrostatic potential maps (Figure 4.15). Methane is non-polar and the main source of attraction in the methane dimer is dispersive forces (which are hard to visualize). Water is polar, and the methane–water interaction (where the water is the H-donor) is a bit stronger than the methane dimer. This is due to an electrostatic interaction - more specifically polarization, but more about this in a future post.
Figure 4.15. 0.002 au isodensity surface with superimposed molecular electrostatic potential for (a) methane dimer, (b) water–methane dimer where water acts as an H-bond donor, (c) water–methane dimer where methane acts as an H-bond donor, and (d) water dimer. The maximum potential value is 0.05 au and the level of theory is M06/6-31+G(2d,p)//M06/6-31G(d).
Click on the picture for an interactive version.
Click here for a pop-up window
From Molecular Modeling Basics CRC Press, 2010
Click on the picture for an interactive version.
Click here for a pop-up window
From Molecular Modeling Basics CRC Press, 2010
Instructions on how to make interactive electrostatic potential maps with Jmol can be found here. Finally, I introduce a new feature (pop-up windows) to the blog because I can't figure out how to include Jmol buttons (which gives more control to the viewer) into blog posts. This feature also gives you access to the underlying GAMESS files as I have discussed here.


No comments:
Post a Comment